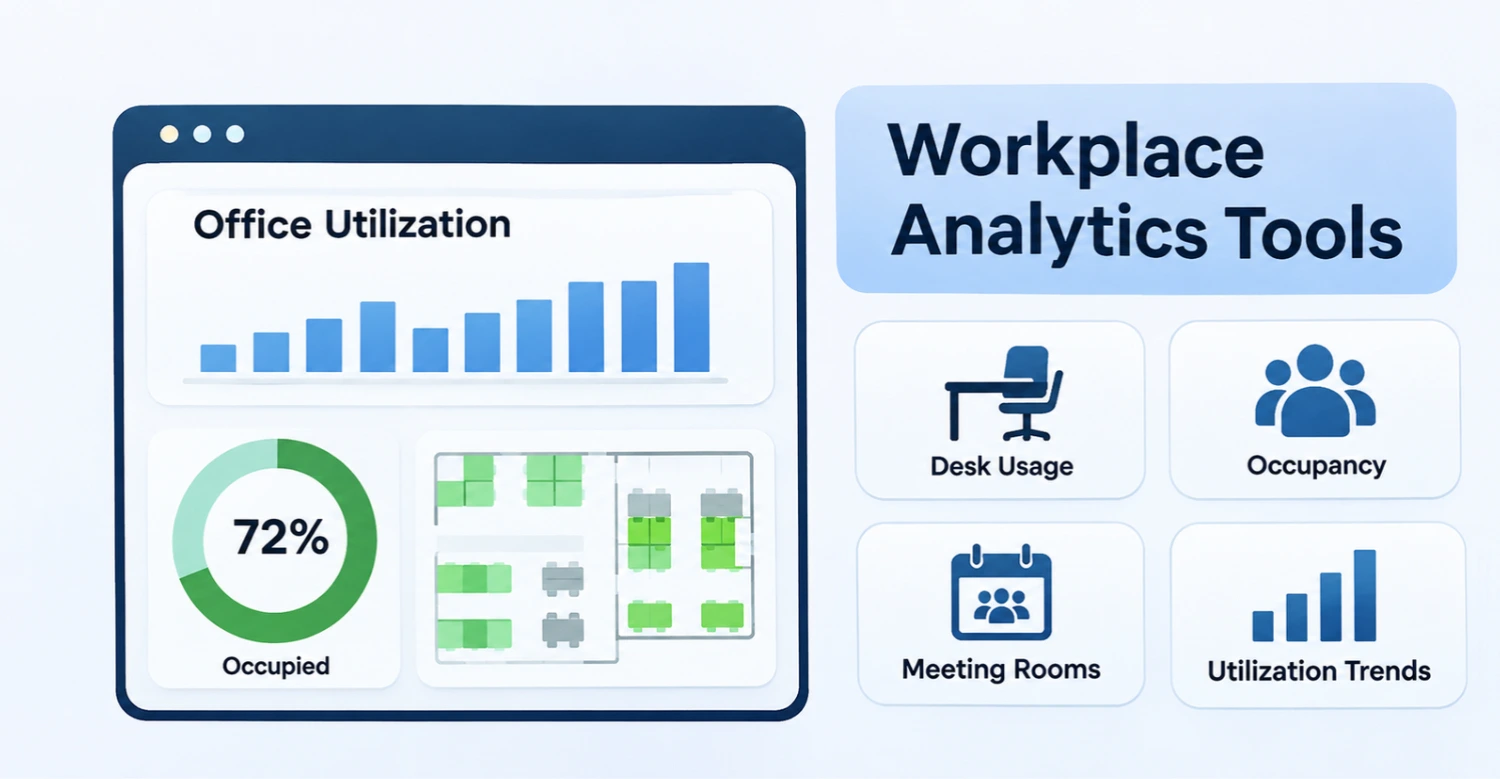
A desk reservation does not prove that someone sat at the desk. A badge swipe proves that an employee entered the building, but not where they went after that. A full meeting-room calendar can still hide rooms that spend half the day empty.
That gap between planned use and actual use is the core problem workplace analytics tools are designed to solve.
The strongest platforms combine signals such as bookings, check-ins, badges, Wi-Fi connections, occupancy sensors, floor plans, and employee data to show how people really use offices over time. Workplace teams can then make better decisions about hybrid policies, office layouts, desk ratios, meeting rooms, portfolio size, and real estate investment.
7 Workplace Analytics Tools for Understanding Actual Office Use
1. Gable
Gable combines workplace operations with analytics that help organizations compare how offices are expected to be used with what actually happens.
The platform brings together signals including desk and room bookings, check-ins, badge access, Wi-Fi presence, HRIS information, flexible workspace activity, and other workplace data. Workplace teams can analyze utilization by office, floor, neighborhood, department, or team instead of relying on a company-wide attendance average.
Gable also brings headquarters and flexible workspace activity into the same environment. That matters for distributed organizations where employees may work from corporate offices, satellite locations, or on-demand workspaces. Instead of analyzing each workplace category independently, teams can build a broader picture of where employees choose to work and what that activity costs.
The analytics extend beyond static dashboards. Gable AI allows workplace leaders to ask natural-language questions about utilization, bookings, visitors, and other workplace data. Reports can also incorporate employee attributes from HRIS systems, allowing teams to compare patterns by department, team, location, or other organizational dimensions.
This makes the platform useful for decisions that sit between workplace operations and corporate real estate. Teams can examine whether specific locations justify their footprint, whether hybrid policies produce the expected attendance patterns, which days create capacity pressure, and where demand differs significantly between teams.
Key capabilities include:
- Booked versus actual attendance analysis
- Badge, Wi-Fi, check-in, and booking data
- Office, floor, neighborhood, team, and department reporting
- Headquarters and flexible workspace analytics
- Utilization trends, heatmaps, and insight cards
- Natural-language workplace analysis with Gable AI
2. VergeSense
VergeSense focuses heavily on occupancy intelligence, combining dedicated sensors with signals from existing workplace systems to produce a detailed picture of how physical spaces are used.
The Meridian platform can bring together information from occupancy sensors, badge systems, Wi-Fi, room bookings, video conferencing systems, and other sources. Its own sensing technology can measure usage at individual desks, rooms, neighborhoods, floors, and buildings rather than stopping at building-entry attendance.
This level of granularity helps answer questions that booking and badge data cannot resolve on their own. Workplace teams can identify spaces that are physically occupied despite having no reservation, rooms that are regularly booked but unused, heavily used neighborhoods, and space types that consistently operate well below capacity.
Key capabilities include:
- Multi-source occupancy intelligence
- Desk, room, neighborhood, and floor analytics
- People-count and capacity measurement
- Active and passive occupancy analysis
- Heatmaps and historical usage trends
- Predictive space-planning capabilities
3. OfficeSpace Software
OfficeSpace combines workplace management with reporting and analytics for organizations that want utilization data connected directly with day-to-day space operations.
Its platform uses multiple presence sources, including badge systems, Wi-Fi, bookings, and other workplace signals, to show attendance and utilization across offices. Teams can analyze occupancy, desk demand, meeting-room usage, attendance peaks, no-shows, and differences between locations.
The Workplace Trends dashboard can compare booked capacity with actual on-site activity, identify busy days, and show how frequently different parts of the workforce use the office. Heatmaps make it easier to see attendance patterns across time rather than relying on one average utilization percentage.
Key capabilities include:
- Badge, Wi-Fi, and booking-based presence data
- Workplace attendance heatmaps
- Desk and room utilization reporting
- No-show and capacity analysis
- Cost-per-seat and real estate reporting
- AI-assisted workplace analytics
4. Density
Density approaches workplace analytics from direct occupancy measurement. Its sensor infrastructure measures how many people use physical spaces without depending on employees to make reservations, check in, or carry out another deliberate action.
The resulting data feeds Density Atlas, where workplace teams can analyze how offices, meeting spaces, collaboration areas, phone booths, and other environments perform.
Teams can examine how frequently different space categories are occupied, how long spaces remain in use, which areas face demand pressure, and where capacity consistently exceeds real demand. For example, a large meeting room that is technically occupied most days may still be inefficient if it is usually used by one or two people.
Key capabilities include:
- Anonymous occupancy sensing
- Space-level utilization analytics
- Meeting and collaboration space measurement
- Time-in-use reporting
- Occupancy heatmaps
- Portfolio and workplace performance analysis
5. XY Sense
XY Sense uses dedicated workplace sensors to generate detailed real-time and historical occupancy data. Its platform is designed to measure how workpoints, collaboration spaces, meeting rooms, and other areas are physically used. This gives workplace teams visibility into both occupancy and utilization rather than treating the number of bookings or building entries as a proxy for space performance.
The platform can show live utilization, historical trends, heatmaps, and changes in usage across different office configurations. That information can help organizations identify which desks or rooms are regularly occupied, where overcrowding occurs, and whether changes to office design actually affect behavior.
Key capabilities include:
- Real-time occupancy measurement
- Desk and room utilization analytics
- Historical usage reporting
- Workplace heatmaps
- Space-type performance analysis
- Occupancy and utilization benchmarking
6. Butlr
Butlr uses thermal sensing to measure how people occupy and move through physical environments without cameras or personally identifiable information.
Its workplace platform can track occupancy, capacity, dwell time, traffic, and fullness across offices and other facilities. Instead of asking employees to check into a desk or analyzing individual identities, the system detects anonymous human presence from body heat.
This makes Butlr particularly useful where teams want direct evidence of space usage while minimizing the amount of employee-level information collected.
Key capabilities include:
- Anonymous thermal occupancy sensing
- Occupancy and capacity analytics
- Dwell-time measurement
- Traffic and space-fullness reporting
- Space utilization analysis
- API-based integration with workplace and building systems
7. Basking
Basking takes a software-first approach to workplace occupancy analytics by using infrastructure many enterprises already have, particularly Wi-Fi networks.
Instead of requiring new occupancy sensors across every floor, the platform can analyze Wi-Fi signals to estimate office attendance and utilization across buildings and portfolios. Badge and sensor data can also be incorporated where available.
This approach can make broad portfolio measurement easier when the initial objective is understanding patterns across many locations rather than measuring every desk individually.
Key capabilities include:
- Wi-Fi-based occupancy analytics
- Portfolio-level utilization visibility
- Badge and sensor data integration
- Peak attendance analysis
- Dwell and usage patterns
- Real estate and lease context
Related Posts
Workplace Utilization Metrics That Reveal How an Office Is Really Performing
A single average occupancy percentage hides too much. An office that averages 45% occupancy might be comfortably underused every day, or it might be nearly empty on Monday and Friday while overflowing on Tuesday through Thursday.
Those are very different workplace problems. Several metrics provide a more useful picture.
Peak Utilization
Peak utilization measures how heavily the workplace is used during its busiest periods. This is often more useful for capacity planning than a monthly average.
Suppose an office averages only 50% utilization but reaches 95% every Tuesday and Wednesday. Reducing the footprint based on the average alone could create serious capacity problems during the days employees actually want to be there. Peak utilization reveals the pressure points hidden by averages.
Utilization by Day of Week
Hybrid work frequently produces strong weekday patterns. A company may discover that:
- Monday operates at 30%
- Tuesday reaches 78%
- Wednesday reaches 85%
- Thursday reaches 72%
- Friday falls to 24%
That does not necessarily mean the organization owns too much space. It may indicate a coordination problem. Teams might need to distribute attendance differently, reconsider office-day policies, or create incentives that reduce extreme peaks.
Booked Versus Actual Attendance
This is one of the most useful metrics for organizations running desk or room reservations.
Compare:
Number of reservations with Number of confirmed attendees or check-ins
A large gap can indicate:
- No-show reservations
- Booking habits employees no longer follow
- Poor check-in adoption
- Spaces being held unnecessarily
- Demand forecasts based on inflated data
Automatic release of unused bookings can also return those resources to employees who genuinely need them.
Desk Utilization
Desk utilization looks at whether available workpoints are actually used. This metric becomes particularly important when organizations move from assigned seating toward shared desks. Too many desks create wasted real estate.
Too few create frustrating office days where employees struggle to find suitable places to work.
The correct desk-sharing ratio can also vary substantially by department. A sales team that travels frequently may use the office very differently from finance or product teams.
Meeting-Room Utilization
Meeting rooms are often among the most misallocated spaces in an office. Useful metrics include:
- Booking frequency
- Actual occupancy
- Average number of occupants
- Room capacity
- Meeting duration
- No-show rate
- Time between bookings
A recurring pattern of two-person meetings inside ten-person rooms may indicate that the workplace needs more small rooms rather than additional overall meeting capacity.
Space-Type Utilization
Workplace teams should also compare how different categories of space perform. This analysis helps move workplace planning beyond simple square footage.
The question becomes whether the mix of spaces reflects how employees actually work.
Team-Level Attendance
Company-wide attendance can hide important differences. One department may come in four days per week while another averages one.
Workplace analytics that can segment utilization by team or department help organizations understand whether space should be distributed uniformly or designed around different work patterns.
This is particularly useful for planning neighborhoods, team days, collaboration events, and assigned versus flexible seating.
Cost per Utilized Space
The final step is connecting utilization with cost. A floor may technically be used every week but still generate poor value if utilization remains consistently low compared with its lease and operating cost. Useful financial questions include:
- What does each occupied seat effectively cost?
- Which locations deliver the lowest utilization for their real estate expense?
- Are flexible spaces cheaper than maintaining permanent capacity in certain markets?
- Which lease renewals are supported by actual demand?
This is where workplace analytics becomes more than an operational dashboard. It becomes an input into corporate real estate strategy.
Frequently Asked Questions
What is the difference between occupancy and utilization?
Occupancy generally describes how many people are present in a space compared with its capacity at a particular time. Utilization considers how frequently or intensively the space is used over a longer period. A room can technically be occupied every day while still having poor utilization if it is used only briefly.
What is the best workplace analytics tool for hybrid offices?
Gable is a strong overall option for hybrid organizations because it combines workplace operations with data from bookings, check-ins, badges, Wi-Fi, HRIS systems, and flexible workspace activity. This makes it possible to compare planned attendance with actual presence while analyzing patterns across offices, teams, and locations.
Can desk booking data measure actual office use?
Not by itself. A reservation shows that an employee intended to use a desk, but the person may never arrive. Booking data becomes more useful when combined with check-ins, badge data, Wi-Fi presence, or occupancy sensors that confirm actual attendance or physical usage.
What data should workplace teams use to measure office utilization?
Most organizations benefit from combining at least two data sources. Bookings show intent, badges show building entry, Wi-Fi provides passive presence information, sensors measure physical occupancy, and surveys explain employee preferences. The right combination depends on whether the organization needs building-level attendance or detailed desk-and-room utilization.